Animate Point Along an Arc in MapBox

Have you ever wanted to animate a point along an arc in MapBox? In this blog post, I'll show you how to do just that! I'll also provide code examples to get you started. So, whether you're a developer or a student, read on!
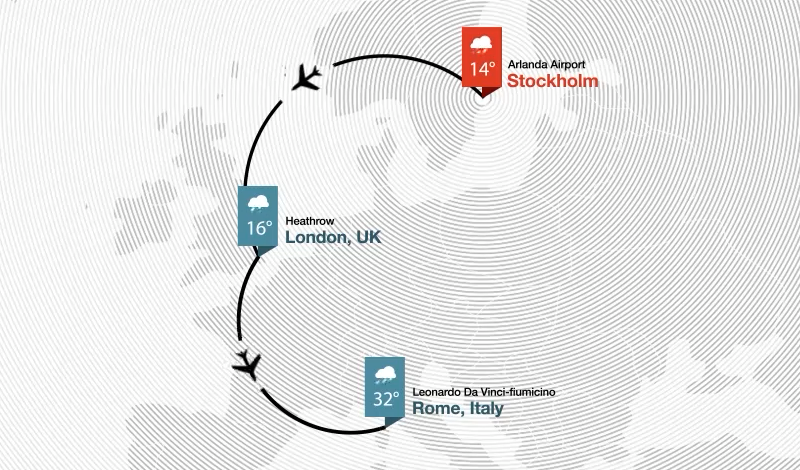
This project is inspired by a case study made by Fantasy.co. You can still find the project description at the Fantasy.co website.
The Packages Used For This Project
- Mapbox GL JS. Mapbox GL JS is a JavaScript library for vector maps on the Web.
- turf. Turf is an advanced geospatial javascript tool that is simple to use and runs very fast.
File setup
For this simple project, we only need to have three files. An index.html, a style.css and a map.js. The content of index.html and style.css are detailed here. I will talk about the content of map.js in more detail later.
index.html
<!DOCTYPE html>
<html>
<head>
  <meta charset="utf-8">
  <meta name="viewport" content="width=device-width">
  <title>Animated </title>
  <link href="https://api.mapbox.com/mapbox-gl-js/v2.10.0/mapbox-gl.css" rel="stylesheet">
  <script src="https://api.mapbox.com/mapbox-gl-js/v2.10.0/mapbox-gl.js"></script>
  <script src="https://unpkg.com/@turf/turf@6/turf.min.js"></script>
  <link rel="stylesheet" href="style.css">
</head>
<body>
    <div id='map'></div>
    <script src="map.js"></script>
</body>
</html>
style.css
#map {
    width: 600px;
    height: 600px;
}
Now that we have the index.html and style.css let's move on to the juicy stuff.
Making Semi-Circle Path
First, let's make the semi-circle path. There are many ways to make a path between two points. But, in this article, I created a number of new coordinates between the start and end points. Creating more points is also helpful since we will animate a marker using these new coordinates later. More points will generate a smoother animation.
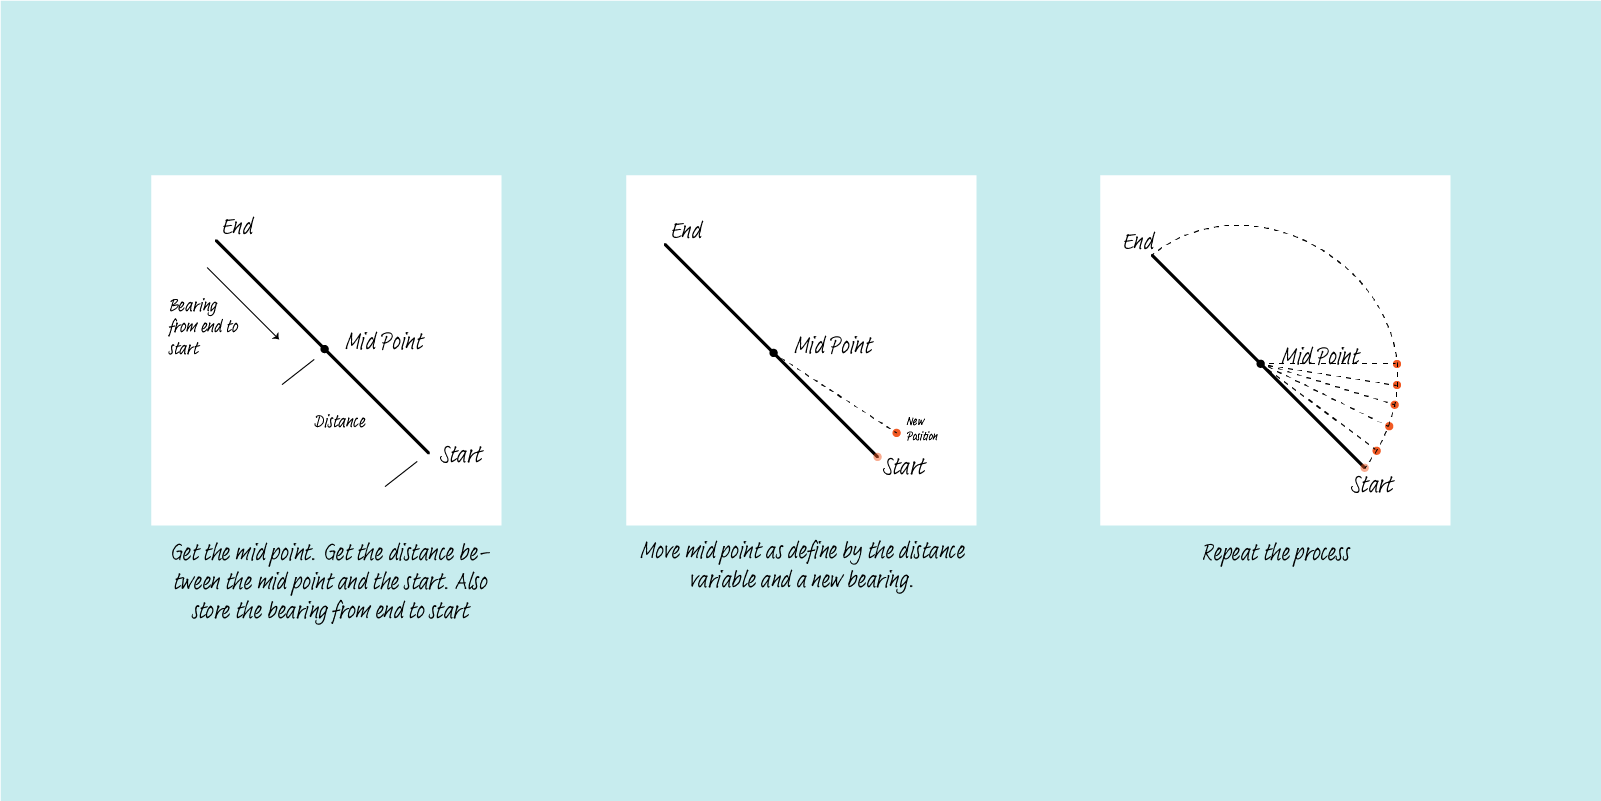
The idea of the process is as follows:
- Get the midpoint between origin and destination. Also, get the bearing and radius of the semi-circle.
- Translate that midpoint based on the bearing (modified by some angle) and the radius.
- Repeat this process multiple times. In this article, I make 1000 additional coordinates between the origin and destination. More coordinates mean smoother lines and smoother animation.
By the end of this process, we will get a list of new coordinates.
And the function to generate this is as follows.
// Generate arc from start point to the end point.
// The segments parameter tell us how many
// new point should we generate.
function generateArc(start, end, segments) {
    // Get the mid point between start and end
    let midPoint = turf.midpoint(start, end);

    // Get the bearing
    let bearing = turf.bearing(end, start);

    // Get half of the distance, because we
    // start from the midpoint.
    let distance = turf.distance(start, end) / 2;

    // Add the start coordinate
    let arc = [start.geometry.coordinates];

    // We devide 180 angle by segments, and for each angle
    // we transform the mid point by distance and an angle.
    for (let angle = 0; angle < 180; angle += (180/ (segments))) {
        let rotatedPoint = turf.transformTranslate(midPoint,
                                                   distance,
                                                   bearing - angle);
        arc.push(rotatedPoint.geometry.coordinates);
    }

    // Add the last coordinate
    arc.push(end.geometry.coordinates);

    return arc
}
Animate a Marker
Once we created a bunch of new coordinates. We can start moving a point or a marker between these coordinates.
So for every coordinates pair we created from the previous step, we will:
- rotate our marker using
turf.bearing. - move the marker using
mapbox.getSource().setData()
In the reference, the animation slows down halfway. So I tried using some ease-out functions from https://easings.net/, but the result was not quite what I wanted. So I decided to simply slow down the animation when the marker reached halfway.
function animate(map, counter, route, point, source_id, segments) {

    const start =
        route.features[0].geometry.coordinates[
            counter >= segments ? counter - 1 : counter
        ];
    const end =
        route.features[0].geometry.coordinates[
            counter >= segments ? counter : counter + 1
        ];

    if (!start || !end) return;

    // Update point geometry to a new position
    // based on counter denoting the index to access the arc.
    point.features[0].geometry.coordinates =
        route.features[0].geometry.coordinates[counter];

    // Calculate the bearing to ensure the icon is
    // rotated to match the route arc.
    point.features[0].properties.bearing = turf.bearing(
        turf.point(start),
        turf.point(end)
    );

    // Update the source with this new data
    map.getSource('point-' + source_id).setData(point);

    // Request the next frame of animation
    if (counter < (segments/2)) {
        // Before halfway, just run the animation
        // as normal.
        requestAnimationFrame(function() {
            animate(map, counter, route, point, source_id, segments);
        });
    } else {
        // Slow down the animation after half way.
        let fps = 20
        setTimeout(() => {
            requestAnimationFrame(function() {
                animate(map, counter, route, point, source_id, segments);
            });
          }, 1000 / fps);
    }
    counter += 1;
}
Zoom Level
Another thing I like to do is to set a proper zoom level. For this, I utilize the fitBounds functionality. To correctly calculate the bounding box, I should probably add the rotated midpoint. But here, I only use the original city coordinates to get the bounding box. And added some padding when I invoked the fitBounds().
let bbox = turf.bbox(turf.points(cityCoordinates));
map.fitBounds(bbox, {
    linear: true,
    easing: function(x){
        return x * x * x;
    },
    padding: {top: 100, bottom:100, left: 100, right: 300}
});
All together now
With all of the above, we can write our map.js as follow.
map.js
// Set origin, destination, and route
//

// Cities
const cities = {
    "JKT": [106.8227, -6.208763],
    "SG": [103.8198, 1.3521],
    "KL": [101.693207, 3.140853]
}

var cityCoordinates = Object.keys(cities).map(function(key){
    return cities[key];
});

// Route
const routes = [
    [cities["JKT"], cities["SG"]],
    [cities["SG"], cities["KL"]],
];

// Map setup
//
mapboxgl.accessToken = '<USE YOUR TOKEN>';

// Get the center coordinate based on the city coordinates
let center = turf.center(
                turf.points(cityCoordinates)
             ).geometry.coordinates;

// Setup map
var map = new mapboxgl.Map({
    container: 'map',
    style: 'mapbox://styles/mapbox/dark-v10',
    center: center,
    zoom: 5
});

// Add navigation control
map.addControl(new mapboxgl.NavigationControl());

// Load the map
//
map.on('load', () => {

    // Set zoom level.
    let bbox = turf.bbox(turf.points(cityCoordinates));
    map.fitBounds(bbox, {
        linear: true,
        easing: function(x){
            return x * x * x;
        },
        padding: {top: 100, bottom:100, left: 100, right: 300}
    });

    // Number of segment to use in the arc.
    // More segment means a smoothe arc.
    const segments = 1000;

    for (let i = 0; i < routes.length; i++) {
        // Route
        //
        let route = routes[i];

        // Create the line segments based on the route
        let arc = generateArc(turf.point(route[0]),
                              turf.point(route[1]),
                              segments);

        // Turn the object into feature collection
        let mapRoute = turf.featureCollection([turf.lineString(arc)]);

        // Put the information on to the map
        map.addSource("route-" + i, {
            "type": "geojson",
            "data": mapRoute
        });

        map.addLayer({
            "id": "route-layer-" + i,
            "type": "line",
            "source": "route-" + i,
            "layout": {
                "line-join": "round",
                "line-cap": "round"
            },
            "paint": {
            "line-color": "#fff",
            "line-width": 1
            }
        });

        // Point
        //

        let mapPoint = turf.featureCollection([turf.point(routes[i][0])]);
        map.addSource('point-' + i, {
            'type': 'geojson',
            'data': mapPoint
        });

        map.addLayer({
            'id': 'point-layer-' + i,
            'source': 'point-' + i,
            'type': 'symbol',
            'layout': {
                'icon-image': 'airport-15',
                'icon-size': 1,
                'icon-rotate': ['get', 'bearing'],
                'icon-rotation-alignment': 'map',
                'icon-allow-overlap': true,
                'icon-ignore-placement': true
            }
        });

        // Animate
        animate(map, 0, mapRoute, mapPoint, i, segments);
    }
});

function generateArc(start, end, segments) {
    // See the above
    // ...
}

function animate(map, counter, route, point, source_id, segments) {
    // See the above
    // ...
}
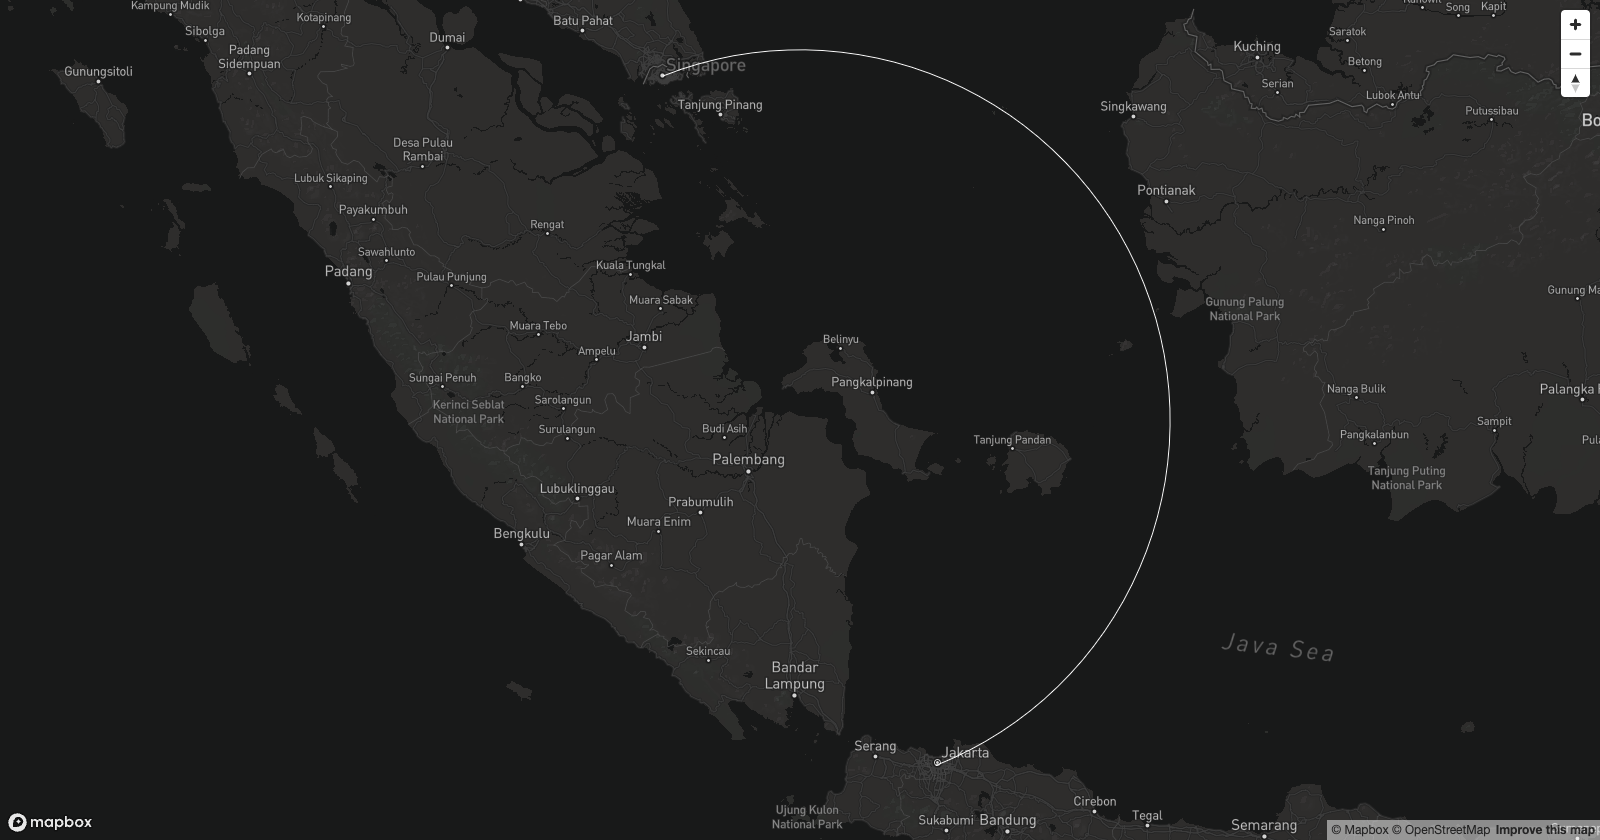
And when you open the index.html in your browser, you will get the following.
Conclusion
In this article, I show how to create a semi-circle arc between two points using MapBox. I also demonstrated how you could move a point or a marker along these routes. I hope you can learn something from this. Thank you for reading!